
Quantitative Stock Selection Strategy Based on Multi-Scale Transformer
This project proposes a quantitative stock selection strategy based on Multi-Scale Transformer, aiming to mine non-linear Alpha factors in the A-share market through deep learning models.
The strategy combines traditional volume-price factors (Alpha 101) with modern attention mechanisms, enabling it to capture both long-term and short-term price fluctuation patterns in complex market environments.
Performance Overview
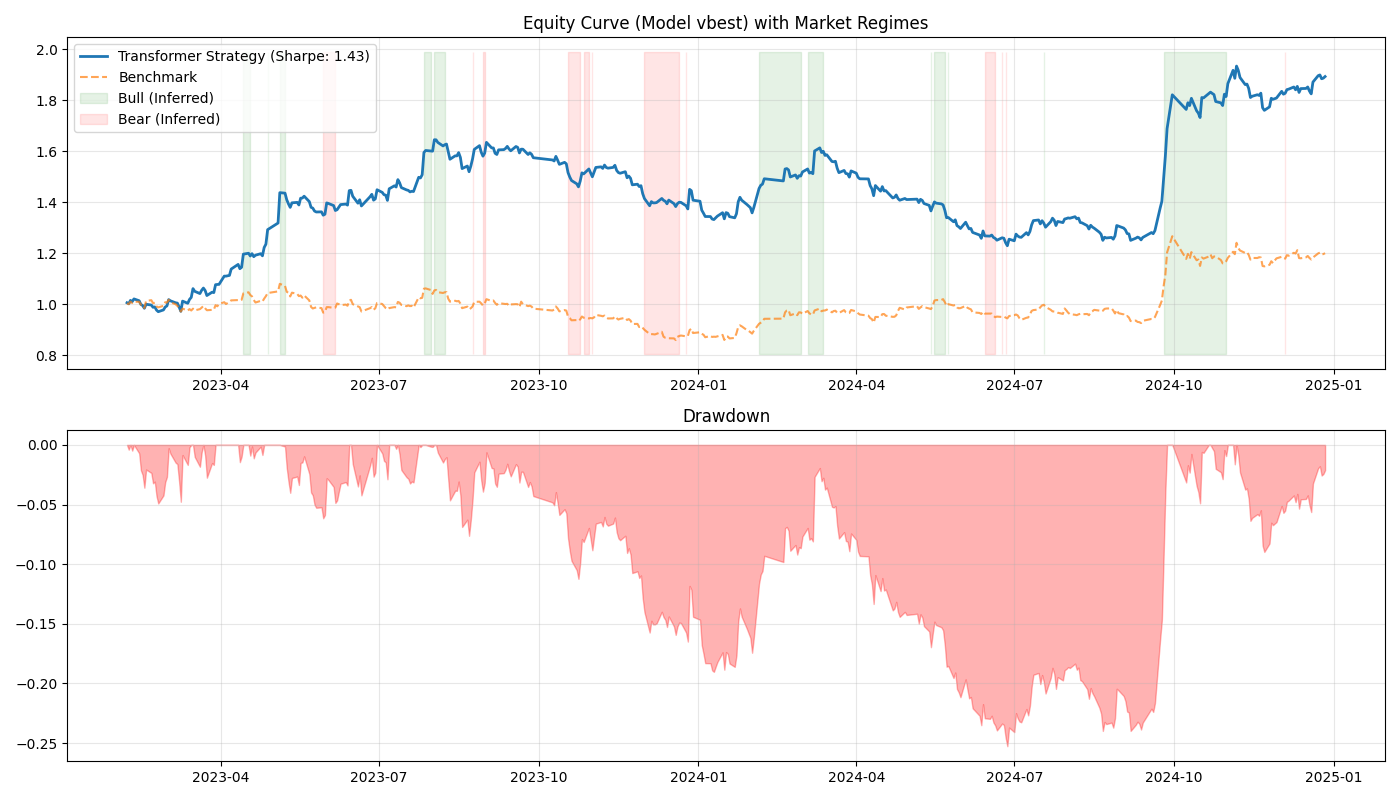 Figure 1: Equity Curve (Model vbest) with Market Regimes
1. Trading Signal Analysis (601857)
Detailed view of model signals on the best performing asset.
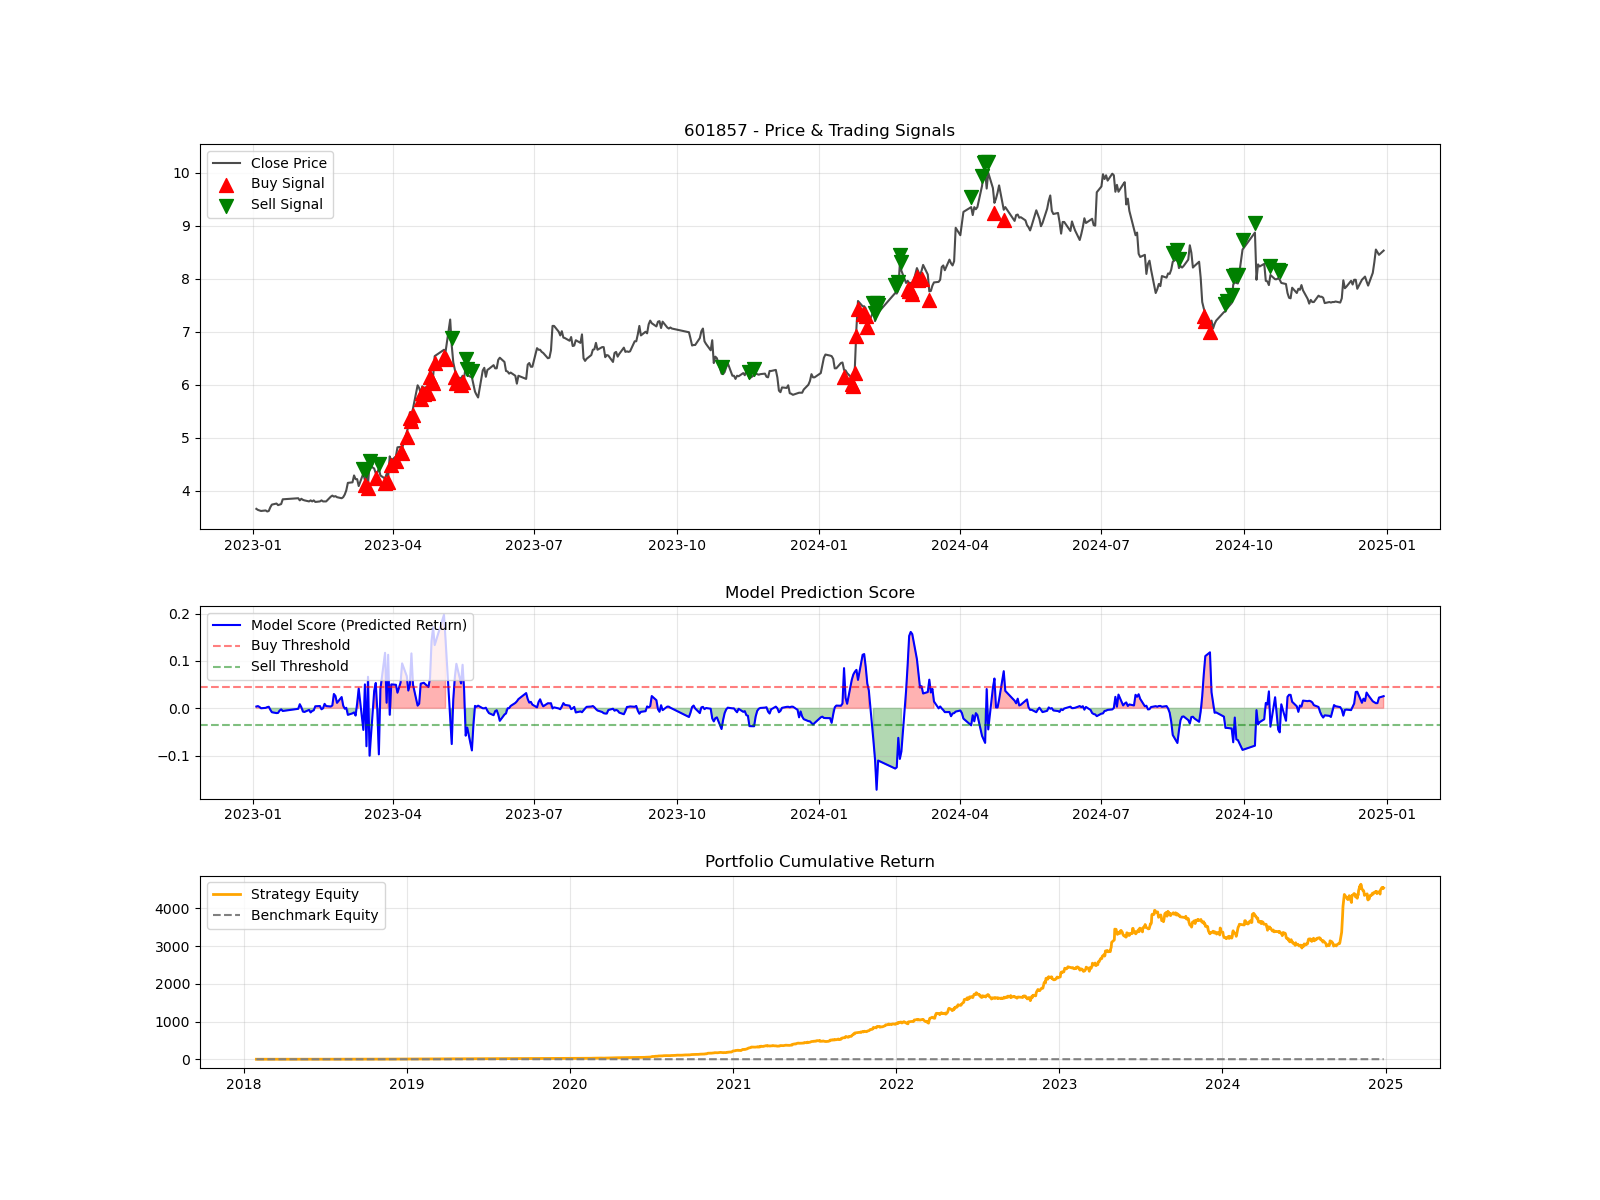 Figure 2: Price & Trading Signals (Stock 601857)
2. Key Performance Metrics
| Metric | Strategy | Benchmark |
|---|---|---|
| Total Return | 89.34% | 20.08% |
| Annualized Return | 41.55% | 10.47% |
| Annualized Volatility | 0.2512 | 0.1925 |
| Sharpe Ratio | 1.4275 | 0.5089 |
| Max Drawdown | -25.27% | -20.40% |
| Win Rate | 45.57% | 48.81% |
3. Advanced Risk Metrics
- Sortino Ratio: 3.6661
- Calmar Ratio: 1.6444
- Profit Factor: 1.3209
- Alpha: 0.2916
- Beta: 1.0610
4. Market Regime Analysis (Sub-period)
Performance broken down by inferred market regimes (based on Benchmark behavior).
| Regime | Annualized Return | Sharpe | Win Rate |
|---|---|---|---|
| Bull Market | 243.37% | 5.88 | 50.77% |
| Bear Market | -49.94% | -2.84 | 38.10% |
| Sideways/Volatile | 10.69% | 0.51 | 45.51% |
5. Rank Ability (IC)
- Mean IC: 0.0843
- ICIR: 0.2895
6. Strategy Settings
- Top K: 5
- Position Sizing: Equal Weight
- Stop Loss: -3%
- Transaction Cost: 10 bps